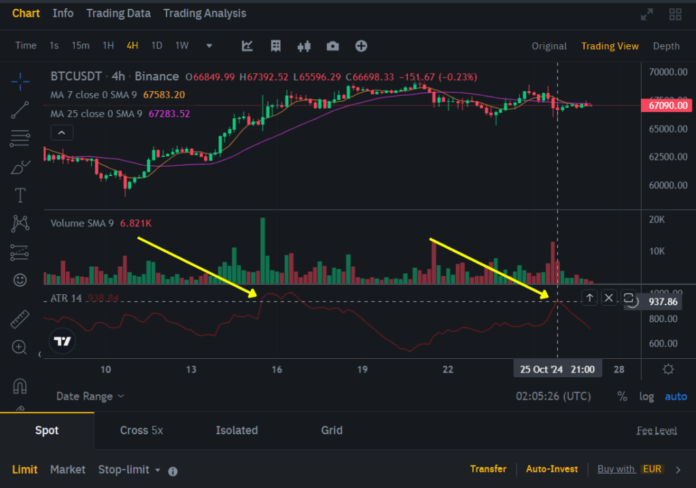
Why Volatility Is Both a Risk and an Advantage
Volatility is what makes the cryptocurrency market both exciting and intimidating. In a matter of hours, assets can rise by double digits or collapse just as quickly. For unprepared traders, these swings feel chaotic. For those equipped with the right tools, however, volatility represents profit opportunities.
Instead of relying on instinct, professional traders use advanced analytics to navigate these conditions. Among the most effective solutions are the crypto screener and the RTT graph, which together help traders filter out noise, analyze liquidity, and act with precision.
Finding Opportunities with a Screener
The first challenge any trader faces is the overwhelming number of tokens available. With thousands of coins listed across multiple exchanges, deciding where to focus is nearly impossible without automation. That’s why screeners have become a standard tool.
A crypto screener scans the market for coins that meet predefined conditions such as:
- price changes over specific timeframes;
- unusual trading volume compared to historical averages;
- liquidity depth sufficient for active trading;
- volatility that signals breakout potential.
By instantly reducing the market to a handful of promising assets, screeners save time and ensure no important opportunity is overlooked. They act as a filter, clearing the path for more detailed analysis.
Why Price Alone Doesn’t Tell the Story
Even after identifying potential assets, traders must validate whether the moves they see are genuine. Price action on its own can be misleading. For example, a coin that jumps 20% in an hour may look attractive, but if trading volume is minimal, the rally is likely unsustainable.
Volume and liquidity data reveal whether large players are backing the trend. A steady climb supported by deep liquidity is far more reliable than a thinly traded pump. This validation step is essential before committing capital.
RTT Graphs and the Power of Real-Time Analysis
After filtering assets and checking liquidity, the next question is timing. This is where the RTT graph becomes indispensable. Unlike static charts, RTT graphs provide a dynamic view of how orders flow through the market in real time.
They allow traders to:
- spot when large buy or sell orders enter the order book;
- monitor liquidity shifts around critical support and resistance zones;
- detect momentum fading before it’s obvious on traditional charts.
For scalpers and day traders, this level of granularity is invaluable. It helps them execute trades at the right moment, avoiding late entries or false signals.
Building a Step-by-Step Workflow
The true strength of combining screeners and RTT graphs lies in creating a structured process:
- Start by using a screener to identify assets with unusual activity.
- Validate movements by analyzing volume and liquidity depth.
- Switch to RTT graphs to track live order flow and refine entry points.
- Execute trades with risk controls, including stop-losses and defined position sizes.
This workflow ensures decisions are backed by multiple layers of data rather than emotion or guesswork. Over time, it leads to more consistent and sustainable results.
Risk Management: The Foundation of Profitability
No tool can guarantee success without proper risk management. Crypto remains unpredictable, and sudden reversals are part of the game. Traders who survive and thrive are those who treat risk control as a non-negotiable rule.
Core principles include:
- limiting exposure to a small percentage of total capital per trade;
- cutting losses quickly to preserve capital;
- resisting the urge to overtrade during periods of low opportunity.
When risk management becomes second nature, tools like screeners and RTT graphs serve their purpose effectively, enhancing a disciplined strategy instead of enabling reckless behavior.
The Future of Trading Analytics
Looking ahead, the landscape of trading tools will only become more sophisticated. Expect to see AI-powered screeners that predict potential breakouts and RTT graphs integrated with machine learning to forecast liquidity shifts. These innovations will push the boundaries of what’s possible in real-time market analysis.
Yet one truth remains: tools are only as effective as the trader using them. Combining advanced analytics with discipline, patience, and critical thinking will always be the ultimate formula for long-term success.
