There are many methodologies that exist to manage and solve business errors. Today we are talking about the Ishikawa Diagram. Whether it is to analyze errors in HR processes or in any other department, the Ishikawa Diagram is a tool that allows us to analyze causes and effects in a very visual way. It is especially useful to help us solve process failures and define new strategies to obtain the highest quality in our processes, flows and results.
What is the Ishikawa Diagram
The Ishikawa Diagram is an analysis tool that allows identifying problems and quality failures and putting solutions to them.
What is the Ishikawa diagram for in a company
Why don’t we get the expected results? When errors sneak into a process and we are not able to identify them, we can suffer a loss of competitiveness and profitability. If we do not detect the error and correct it, it will continue to repeat itself, obtaining bad results. In 1943, with this goal, Kaoru Ishikawa created the creator of the Ishikawa diagram, also known as the fishbone diagram. This Japanese chemist wanted to make a more understandable analysis of the failures involved in a process. For more than 80 years, this analysis tool has been used for its effectiveness, evolving to this day and adapting to all types of organizations, industries, teams, work areas and processes.
How to make the fishtail diagram
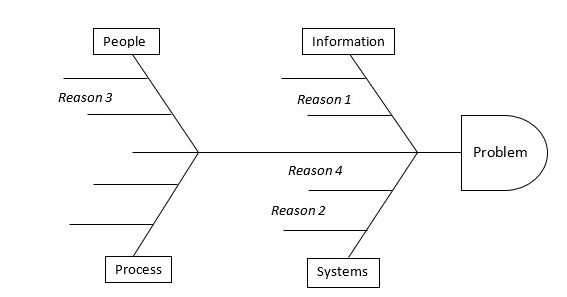
In the first place, we see that the Ishikawa Diagram represents, in a kind of fishbone-shaped graph, the factors and variants that participate in the execution of a process and that generate a problem as a final effect. In this way, in a very visual way, we detect the different failures that add up to generate the problem.
Let’s see below the elements that make up the fish diagram are:
– Head: where the problems are represented.
– Thorns: represent the causes of the problem. The number varies according to the possible causes that are causing the problem.
– Minor thorns: they come out of the major thorns, they are smaller thorns with which the minor causes are represented.
Steps to make an Ikiwasha diagram
– Know your problem
– Define the causes to analyze.
– Draw your Ikishawa diagram
– Analyze, correct and follow up
The cause-effect diagram or Ikishawa diagram helps us improve processes, detecting both failures and areas of opportunity. It adds quality to our work system and, applying it to personnel management processes, allows us to:
– Analyze our problems.
– Discover the flaws.
– Improve decision making.
What other advantages does the cause-effect diagram have to analyze our processes?
– It is a visual system that allows us to identify more quickly where the problems are generated
– It is simple to do.
– It can be applied to the entire company, to a project, department or team, or even at an individual level.
– It adapts to any industry and sector.
You can make your fish diagrams in a simple spreadsheet, or even find templates on sites like Canva or Lucidchart. After all, with this diagram, you will understand the lessons learned better than before.
click here for more articles.