Thanks to increased data availability, powerful computing, and emphasis on data-driven business decisions, Data Science has become high in demand. The two most commonly used programming languages for Data Science are Python and R. Both of these are amazingly flexible and versatile data analytics languages. Python and R are free, open-source, and were created in the early 1990s. Python was developed as a general-purpose, high-level programming language while R was for statistical analysis. If you are interested in working with large datasets, creating data visualizations, or in machine learning, these are essential. Python Certification Training/data science course in bangalore will help you master important Python programming concepts such as Data Operations, File Operations and etc.
Before we understand what language should be used for Data Science, you should get an overview of the languages:
Python
Python was developed with a philosophy emphasizing code efficiency and readability. It is an OOP language meaning that it groups code and data into objects that can modify and interact with one another. Using this approach, data scientists can execute tasks with better modularity, code readability, and stability. Other examples of such languages are C++, Java, and Scala. Python’s specialized machine learning libraries enable data scientists to create sophisticated data models plugged into the production system.
R Programming
R is a procedural language that is used for data analysis and developing statistical software. It works by breaking down a task into a series of subroutines, steps, and procedures. This makes it easy to understand complex operations. However, it can impact code readability and performance. The R community has created open-source packages that a data scientist can use for specific complex problems. It also emphasizes on quality reporting and supports frameworks and visualizations to create interactive web applications.
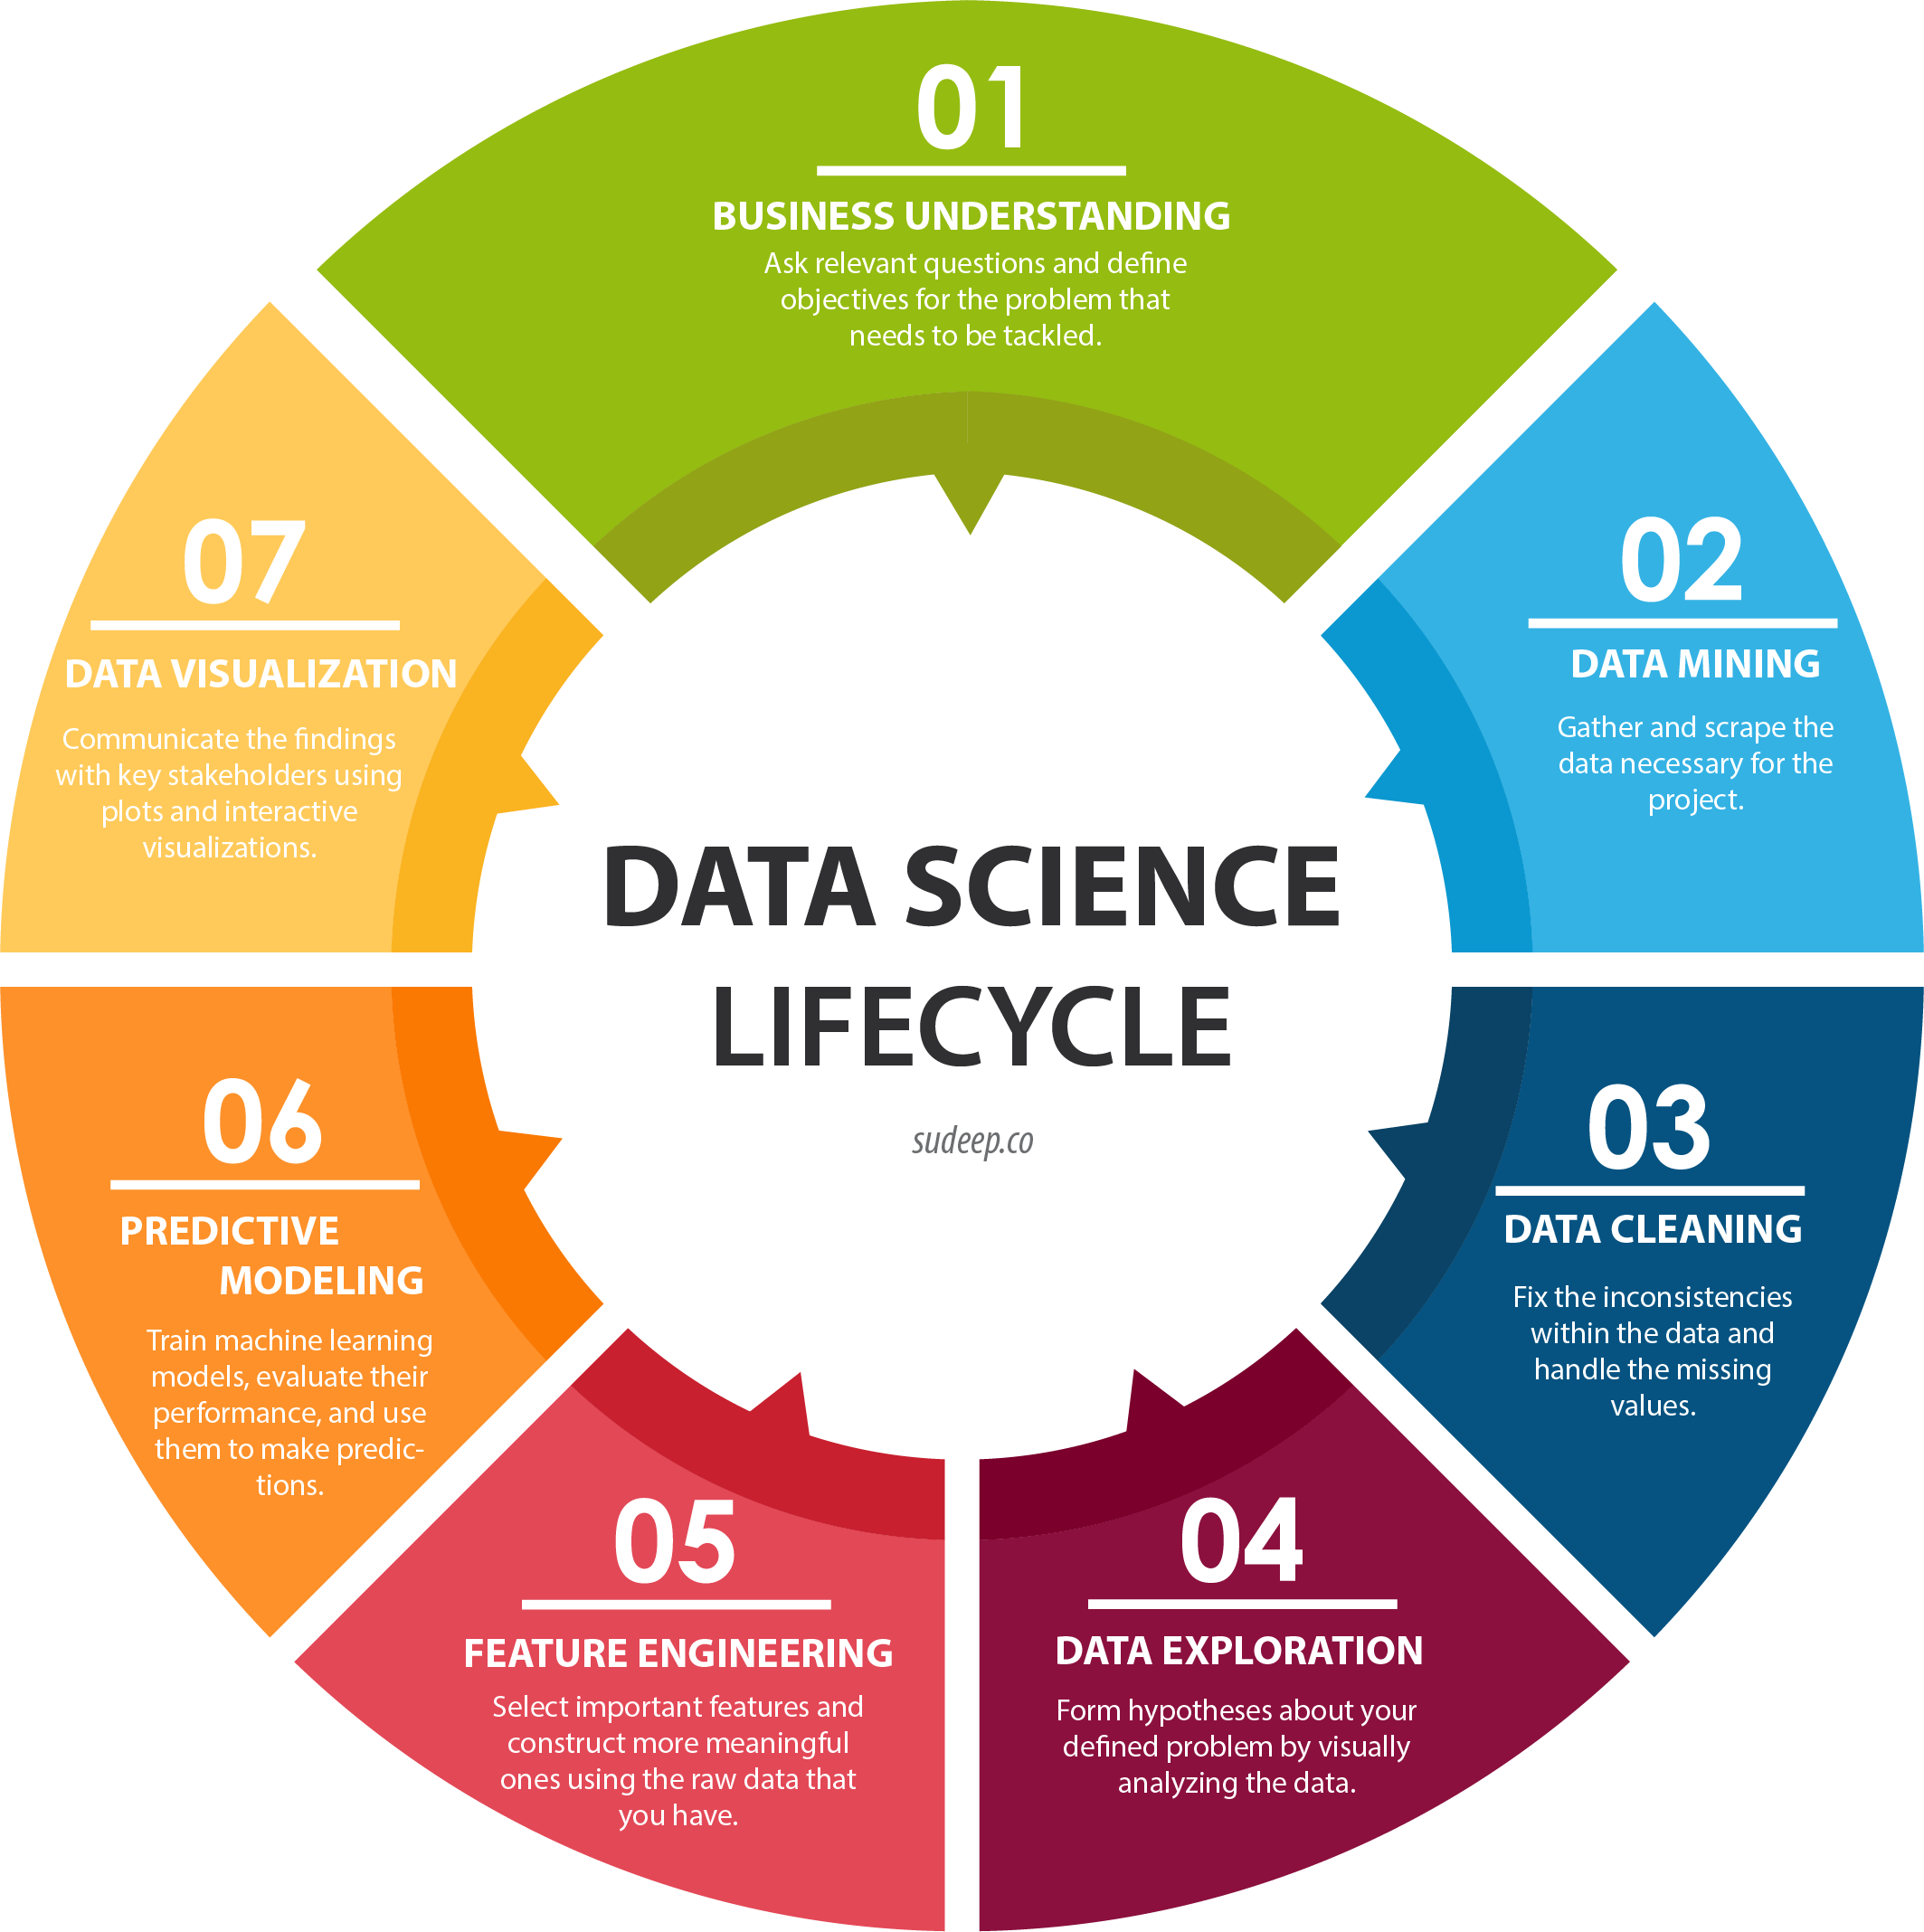
Data Science Processes
Now, let’s dive into the different processes of Data Science and how both these languages can be used in these:
Data Collection
All types of data formats are supported by Python. You can work with web-sourced JSON or Comma-separated value documents. You can even import SQL tables into your code. Using the Python requests library, you just need a line of code for taking data from different websites. HTTP requests are simplified into a line of code. You can take data from Wikipedia tables. Once you have organized data, you can perform an in-depth analysis.
In R, you can import data from CSV, Excel, and from text files. Files built-in SPSS format or Minitab can be transformed into data frames as well. Now, R is not as versatile as Python at grabbing information from the web, but it can handle data from most common sources. To address this issue, several packages have been created for data collection. For example, through Rvest, you can perform basic web scraping. Magrittr can clean and parse the information. These packages can be considered as analogous to the requests and libraries in Python.
Data Exploration
To gather insights from data, you can use the Python’s data analysis library, Pandas. It can hold large volumes of data with no lag. You can also sort, filter, and display data within seconds. Pandas contain data frames that can be defined multiple times in a project. You can start cleaning data by filling non-valid values with a value that can be used for numerical analysis. Pandas will help you scan through the data and clean it.
R was created for performing numerical and statistical analysis. So, you will have several options to explore data using R. It allows you to create probability distributions, use standard data mining and machine learning techniques, and apply different statistical tests to the data. The basic R functionality covers basics of statistical processing, analytics, optimization, signal processing, random number generation, and machine learning. You will have to use third-party libraries for heavier work.
Data Modeling
NumPy can be used for numerical modeling analysis. You can use SciPy for scientific calculation and computing. You can also access several, powerful ML algorithms using the scikit-learn code library. It provides an intuitive interface allowing you to take advantage of everything that ML has to offer without its complexities.
If you are using R for specific modeling analyses, sometimes, you will be relying on packages outside of core functionality of R. These packages can be used for specific analyses like mixtures of probability laws and Poisson distribution.
Data Visualization
Anaconda, which comes with IPython Notebook, has several options for visualizing data. Matplotlib library can be used for generating basic charts and graphs from the embedded data in Python. For better designs or advanced graphs, you can use Plot.ly. It is a data visualization solution that takes data through the Python API and provides beautiful dashboards and graphs. The nbconvert function can transform Python notebooks into HTML documents.
R was created for statistical analysis and demonstrating the results. There are several packages that can be used for making a graphical display. The base graphics module can make all the plots and charts from data matrices. These files can be saved into image formats like .jpg, or as a PDF. Also, you can use ggplot2 for advanced plots like complex scatter plots.
What you should know about selecting one of the languages
Experience with programming – If you already have some experience with programming, you should go for Python. You will find that its syntax is similar to that of other languages, more than the R syntax. You can read Python like a verbal language. The unstandardized code of R might be an issue for some.
Field of work – The main difference between the two languages is being ready for production. Python is a general-purpose programming language that many organizations use in their production systems. R, on the other hand, is favored by academia as it is the statistical programming software. The industries only started using R when open-source R libraries became available.
Statistical learning or Machine Learning – Statistical Learning is a subsection of Statistics, while Machine Learning is a part of Artificial Intelligence. Statistical Learning focuses on models, their interpretability, uncertainty, and precision. Machine Learning, on the other hand, emphasizes on prediction accuracy and large-scale applications.
R was created as a statistical language. So, it is better to do it for that. If you have a statistics background, you will work with R. Python is a better choice for ML when the data analysis has to be integrated with web applications.
Python is a powerful language that can be used for several tasks in the field of computer science. When you learn Python, you will be developing a data science toolkit. Even if you are a non-programmer, you can pick up the language very easily. So, you can go for the Data Science Python course. R is a programming language designed for data analysis. It is important to learn R to make a career in the field of Data Science.
The truth is that when you use both the tools for their respective strengths will improve your skills as a Data Scientist. You need flexibility and versatility to be at the top of your field. It will make you a better Data Scientist.